今回やりたいこと
最適化をJuliaで扱ってみる。
を参照する。
1. 大域最適化と局所最適化
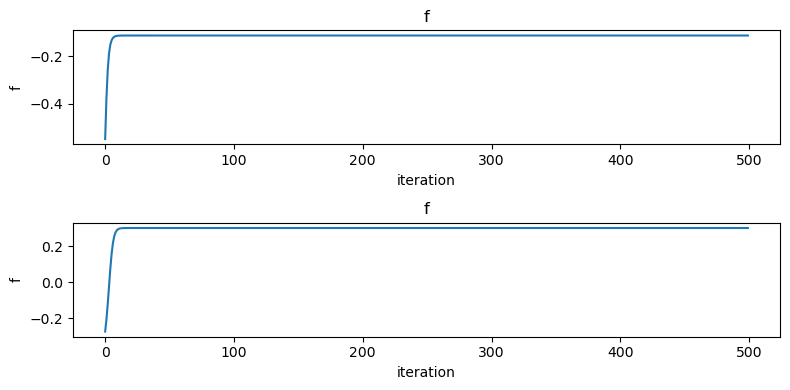
局所最適化に陥っていないかをチェックするため、普通さまざまな初期値を用いて適当な推定値を検討する(機械学習ではこれをハイパーパラメータチューニングという。)。
########################
### 局所最適解の検討 ###
########################

f_cmp(x) = 0.3*cos(3pi*x) -x^2

# 最適化に向けたパラメータ設定
maxiter = 500
eta = 0.01

# 初期値a
x_init_a = -0.8
x_seq_a = gradient_method_1dim(f_cmp, x_init_a, eta, maxiter)
f_seq_a = f_cmp.(x_seq_a)

# 初期値b
x_init_b = 0.25
x_seq_b = gradient_method_1dim(f_cmp, x_init_b, eta, maxiter)
f_seq_b = f_cmp.(x_seq_b)

# 目的関数の値をステップごとにプロット
fig,axes = subplots(2, 1, figsize = (8,4))
axes[1].plot(f_seq_a)
axes[1].set_xlabel("iteration"), axes[1].set_ylabel("f")
axes[1].set_title("f")
axes[2].grid()
axes[2].plot(f_seq_b)
axes[2].set_xlabel("iteration"), axes[2].set_ylabel("f")
axes[2].set_title("f")
axes[2].grid()
tight_layout()

# 関数を可視化する範囲
xs = range(-3, 3, length = 500)

# 最適化の過程
fig, axes = subplots(1, 2, figsize = (12,4))
axes[1].plot(xs, f_cmp.(xs), label = "f_cmp")
axes[1].plot(x_seq_a, f_cmp.(x_seq_a),color = "b", marker = "x", label = "x sequence")
axes[1].set_xlabel("x"), axes[1].set_ylabel("y")
axes[1].grid()
axes[1].set_title("initial value a")
axes[1].legend()

axes[2].plot(xs, f_cmp.(xs), label = "f_cmp")
axes[2].plot(x_seq_b, f_cmp.(x_seq_b),color = "b", marker = "x", label = "x sequence")
axes[2].set_xlabel("x"), axes[2].set_ylabel("y")
axes[2].grid()
axes[2].set_title("initial value b")
axes[2].legend()

tight_layout()


2. 最適化によるカーブ・フィッティング
# 適当な切片、係数パラメータを設定
w = [12.0, 10.0]

# 予測に用いる関数
f(x) = w[1]*x + w[2]

# 関数を可視化する範囲
xs = range(0, 5, length = 100)

# データと予測関数の可視化
fig,ax = subplots()
ax.plot(xs, f.(xs), label = "function")
ax.scatter(X_obs, Y_obs, label = "data")
ax.set_xlabel("X"), ax.set_ylabel("Y")
ax.grid()
ax.legend()

# 誤差関数の定義
E(w) = sum([(Y_obs[n] - (w[1] * X_obs[n] + w[2]))^2
        for n in 1:length(X_obs)])

# 最適化するパラメータの初期値
w_init = [0.0, 0.0]

# 最適化計算の回数
maxiter = 500

# 学習率
eta = 0.01

# 最適化の実行: 最大化アルゴリズムであるから-E[w]を目的関数とする
F(w) = -E(w)
w_seq = gradient_method(F, w_init, eta, maxiter)
f_seq = [F(w_seq[:,i]) for i in 1:maxiter]

w1, w2 = w_seq[:,end]
println("w_1 = $(w1), w_2 = $(w2)")


fig,ax = subplots(figsize = (8,4))
ax.plot(f_seq)
ax.set_xlabel("iteration"), ax.set_ylabel("f")
ax.grid()

# 予測に用いる1次関数
f(x) = w1 * x + w2

# 関数を可視化する範囲
xs = range(0, 5, length = 100)

# データと予測関数のプロット
fig,ax = subplots()
ax.plot(xs, f.(xs), label = "f(x)")
ax.scatter(X_obs, Y_obs, label = "data")
ax.set_xlabel("x"), ax.set_ylabel("y")
ax.grid()
ax.legend()

########################################
### 参考に解析的に計算した結果と比較 ###
########################################

function linear_fit(Y,X)
    N = length(Y)
    w1 = sum((Y.-mean(Y)).*X) / sum((X .- mean(X)).*X)
    w2 = mean(Y) -w1 * mean(X)
    w1, w2
end

w1, w2 = linear_fit(Y_obs, X_obs)
println("w_1 = $(w1), w_2 = $(w2)")

println("w_1 = $(w_seq[1,end]), w_2 = $(w_seq[2,end])")
2. 数値積分
2.1. 1次元の場合
################
### 積分計算 ###
################

# Gauss積分を数値計算する

function approx_integration(x_range, f)
    Delta = x_range[2] - x_range[1]

    sum([f(x) * Delta for x in x_range]), Delta
end

# 近似対象:厳密解はsqrt(pi)
f(x) = exp(- x^2)

# 等間隔の配列を用意
x_range = range(-5, 5, length = 100)

approx, Delta = approx_integration(x_range, f)

# 近似値(approx)と厳密解(exact)の比較
println("approx = $(approx)")
println("exact = $(sqrt(pi))")


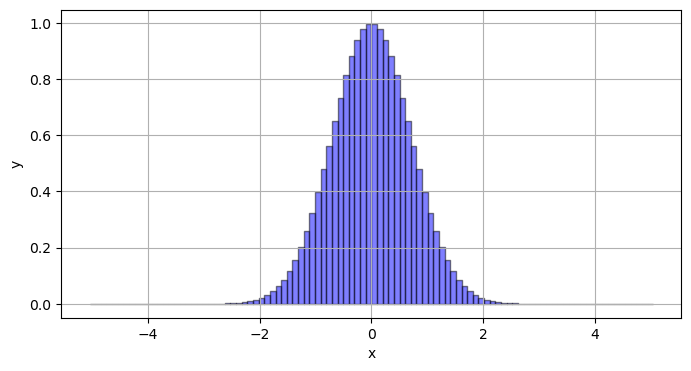
# 関数と近似結果の可視化
fig, ax = subplots(figsize = (8, 4))
xs = range(-5, -5, length = 1000)
ax.plot(xs, f.(xs), "r-")

for x in x_range
    ax.fill_between([x - Delta * 0.5, x + Delta * 0.5], [f(x), f(x)], [0, 0],
                    facecolor = "b", edgecolor = "k", alpha = 0.5)
end

ax.set_xlabel("x"), ax.set_ylabel("y")
ax.grid()

2.2. 多次元の場合
############################
### 多変数関数の数値積分 ###
############################

D = 2 # ベクトルの成分数
A = [0.5 0.3
     0.3 1.0]
f2(x) = exp(-0.5 * x' * A * x)
# 20x20の区画に分割
L = 20
xs1 = range(-5, 5, length = L)
xs2 = range(-5, 5, length = L)

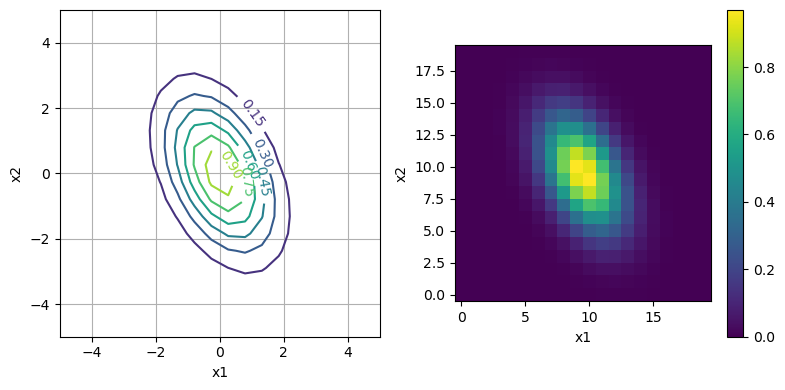
fig,axes = subplots(1, 2, figsize = (8, 4))

# 等高線図で可視化
cs = axes[1].contour(repeat(xs1, 1, L), repeat(xs2', L ,1),
                     [f2([x1, x2]) for x1 in xs1, x2 in xs2]')
axes[1].clabel(cs)
axes[1].grid()
axes[1].set_xlabel("x1"), axes[1].set_ylabel("x2")

# 色表示
cs = axes[2].imshow([f2([x1, x2]) for x1 in xs1, x2 in xs2],
                    origin = "lower")
fig.colorbar(cs)
axes[2].set_xlabel("x1"), axes[2].set_ylabel("x2")

tight_layout()

# 厳密解と比較
# det 関数を用いるべく
using LinearAlgebra

function approx_integration_2dim(x_range, f)
    Delta = x_range[2] - x_range[1]
    sum([f([x1, x2]) * Delta^2 for x1 in x_range, x2 in x_range]), Delta
end

L = 1000
x_range = range(-5, 5, length = L)
approx, Delta = approx_integration_2dim(x_range, f2)

println("approx = $(approx)")
println("exact = $(sqrt((2pi)^D/det(A)))")

