1. 階層ベイズモデル
階層ベイズモデルを線形回帰に適用してみる。
1.1 まずは普通に推定…
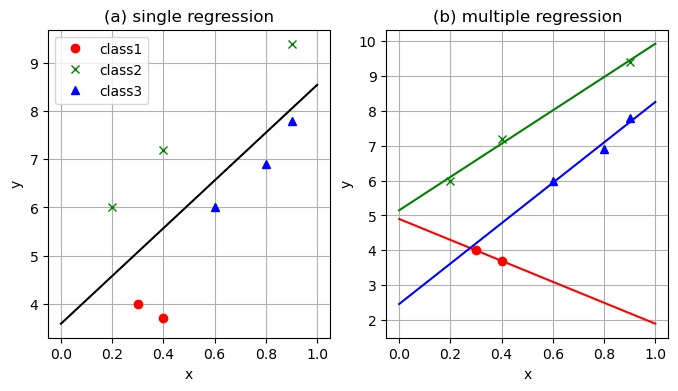
異なるクラスの観測値があるとき、これらを一括で標本とした場合と、クラスごとに標本とした場合の結果を比較してみる。
using Distributions, PyPlot, ForwardDiff, LinearAlgebra

# n次元単位行列
eye(n) = Diagonal{Float64}(I, n)

######
# グラフの諸設定を行う関数
function set_options(ax, xlabel, ylabel, title;
                      grid = true, gridy = false, legend = false)
    ax.set_xlabel(xlabel)
    ax.set_ylabel(ylabel)
    ax.set_title(title)
    if grid
        if gridy
            ax.grid(axis = "y")
        else
            ax.grid()
        end
    end
    legend && ax.legend()
end

######

########################
### 階層ベイズモデル ###
########################

### 全体傾向から個別傾向へと適合させていく

### 3クラスのデータに適用してみる

# 学習データ
X_obs = []
Y_obs = []

# 観測値
push!(X_obs, [0.3, 0.4])
push!(Y_obs, [4.0, 3.7])

push!(X_obs, [0.2, 0.4, 0.9])
push!(Y_obs, [6.0, 7.2, 9.4])

push!(X_obs, [0.6, 0.8, 0.9])
push!(Y_obs, [6.0, 6.9, 7.8])

# 観測値を可視化

fig, ax = subplots()
ax.plot(X_obs[1], Y_obs[1], "or", label = "class1")
ax.plot(X_obs[2], Y_obs[2], "xg", label = "class2")
ax.plot(X_obs[3], Y_obs[3], "^b", label = "class3")
set_options(ax, "x", "y", "data", legend = true)

######

# 線形回帰のパラメータ推定値
function linear_fit(Y,X)
    N = length(Y)
    w₁ = sum((Y .- mean(Y)) .* X) / sum((X .- mean(X)) .*X)
    w₂ = mean(Y) .- w₁*mean(X)
    w₁,w₂
end

######

##############################
### 普通の回帰をやってみる ###
##############################

# 回帰の実行
w₁,w₂ = linear_fit(vcat(Y_obs...), vcat(X_obs...))

# 個々の回帰
w₁s = []
w₂s = []

for i in 1:3
    w₁_tmp, w₂_tmp = linear_fit(Y_obs[i], X_obs[i])
    push!(w₁s, w₁_tmp)
    push!(w₂s, w₂_tmp)
end

# 可視化範囲
xs = range(0, 1, length = 1000)
fig, axes = subplots(1,2,figsize = (8,4))

# 単一の回帰
axes[1].plot(xs, w₁ * xs .+ w₂, "-k")

# 個別の回帰
axes[2].plot(xs, w₁s[1] .* xs .+ w₂s[1], "-r")
axes[2].plot(xs, w₁s[2] .* xs .+ w₂s[2], "-g")
axes[2].plot(xs, w₁s[3] .* xs .+ w₂s[3], "-b")

# データの可視化
for ax in axes
    colours = ["or", "xg", "^b"]
    labels = ["class1", "class2", "class3"]

    for i in 1:3
        ax.plot(X_obs[i], Y_obs[i], colours[i], label = labels[i])
    end
end

set_options(axes[1], "x", "y", "(a) single regression", legend = true)
set_options(axes[2], "x", "y", "(b) multiple regression", legend = false)
データのプロット

推定結果

1.2 階層ベイズモデルによる線形回帰
線形回帰を階層ベイズモデルとして書き直すことを考える。
をクラス
における標本数とし、同時分布でモデルを書き直すと
と書ける。ここではそれぞれ傾きおよび切片に対するハイパーパラメータであり、ここでは
と設定する。具体的にはとする。
ハイパーパラメータが生成されると、それに基づいて各クラスの傾きパラメータ
および切片パラメータ
がそれぞれ
に従って生成される。尤度の部分では、各クラスにおいて、生成されたパラメータを用いて平均値
が決まり、そこに誤差項が加わることで出力値
が生成される。
using Distributions, PyPlot, ForwardDiff, LinearAlgebra

# n次元単位行列
eye(n) = Diagonal{Float64}(I, n)

######
# グラフの諸設定を行う関数
function set_options(ax, xlabel, ylabel, title;
                      grid = true, gridy = false, legend = false)
    ax.set_xlabel(xlabel)
    ax.set_ylabel(ylabel)
    ax.set_title(title)
    if grid
        if gridy
            ax.grid(axis = "y")
        else
            ax.grid()
        end
    end
    legend && ax.legend()
end

### 対数同時分布の設計
# メモリの都合から@viewsとする
@views hyper_prior(w) = logpdf(Normal(0, 10.0), w[1]) + logpdf(Normal(0, 10.0), w[2])
@views prior(w) = sum(logpdf.(Normal.(w[1], 1.0), w[3:5])) + sum(logpdf.(Normal.(w[2], 1.0), w[6:8]))
@views log_likelihood(Y, X, w) = sum([sum(logpdf.(Normal.(Y[i], 1.0), w[2+i].*X[i] .+ w[2+i+3])) for i in 1:3])

log_joint(w, X, Y) = hyper_prior(w) + prior(w) + log_likelihood(Y_obs, X_obs, w)

params = (Y_obs, X_obs)
ulp(w) = hyper_prior(w) + prior(w) + log_likelihood(w, params...)

###

### Hamiltonia Monte Carlo

# Hamiltonian Monte Carlo method
function HMC(log_p_tilde, μ₀; maxiter::Int64, L::Int64, ε::Float64)
    # leapfrog による値の更新
    function leapflog(grad, p_in,μ_in, L, ε)
        μ=μ_in
        p = p_in + 0.5 *ε*grad(μ)
        for l in 1: L-1
            μ +=ε*p
            p += ε*grad(μ)
        end
        μ += ε*p
        p += 0.5 *ε*grad(μ)
        p, μ
    end

    # 非正規化対数事後分布の勾配関数
    grad(μ) = ForwardDiff.gradient(log_p_tilde, μ)

    # サンプルを格納する配列
    D = length(μ₀)
    μ_samples = Array{typeof(μ₀[1]), 2}(undef, D, maxiter)

    # 初期サンプル
    μ_samples[:, 1] = μ₀

    # 受容されたサンプル数
    num_accepted = 1

    for i in 2:maxiter
        # 運動量の生成
        p_in = randn(size(μ₀))

        # リープフロッグ
        p_out, μ_out = leapflog(grad, p_in, μ_samples[:, i-1], L, ε)

        # 比率rの対数を計算
        μ_in = μ_samples[:, i-1]
        log_r = (log_p_tilde(μ_out) +
                 logpdf(MvNormal(zeros(D),eye(D)), vec(p_out))) -
                (log_p_tilde(μ_in) +
                 logpdf(MvNormal(zeros(D),eye(D)),vec(p_in)))

        # 確率rでサンプル受容
        is_accepted = min(1, exp(log_r)) > rand()
        new_sample = is_accepted ? μ_out : μ_in

        # 新サンプルを格納
        μ_samples[:,i] = new_sample

        # 受容された場合、合計を加算する
        num_accepted += is_accepted
    end

    μ_samples, num_accepted
end

###

function inference_wrapper_HMC(log_joint, params, w_init; maxiter::Int64 = 100_000, L::Int64 = 100, ε::Float64 = 1e-1)
    ulp(w) = log_joint(w, params...)
    HMC(ulp, w_init; maxiter = maxiter, L = L, ε = ε)
end

###

# HMCの初期設定
maxiter = 1000
w_init = randn(8)

# 推定の実施
param_posterior, num_accepted = inference_wrapper_HMC(log_joint, params, w_init, maxiter = maxiter, L =100, ε=0.01)

# 予測分布の可視化
fig, axes = subplots(1,3,sharey = true, figsize = (12,4))

for i in 1:3
    for j in 1:size(param_posterior, 2)
        w₁,w₂ = param_posterior[[2+i,2+i+3],j]
        axes[i].plot(xs,w₁.*xs.+w₂, "c-", alpha = 0.1)
    end
    set_options(axes[i], "x", "y", "class $(i)")
end

colours = ["or","xg","^b"]

for i in 1:3
    axes[i].plot(X_obs[i],Y_obs[i],colours[i])
end

tight_layout()

